
Return on average assets is the number people quote when they want to say a credit union is healthy. ROA, or ROAA if you want the full mouthful, is the headline profitability line on your FPR. One number, and everyone thinks they know what it means.
Most of them are reading it wrong. Not because the math is hard. Because they read a quarter as if it were a year, or they cheer a good number without asking where it came from.
Let's fix both. By the end you'll know what a good ROA looks like for a credit union, the one trap that trips up smart people every spring, and how to read your own number the way an examiner reads it.
What ROA measures
ROA answers a blunt question. For every dollar of assets you're carrying, how many cents of profit did you earn?
It's the cleanest read on whether the whole operation is making money. Not one loan, not one branch. The entire balance sheet, working as a machine.
Here's the part people skip, and it's the part that matters most for a credit union. You are not a bank. You don't exist to maximize profit, and nobody expects you to. So why care about ROA at all?
Because earnings are the only real way you build capital over time. No profit, no retained earnings, no growing net worth cushion. The E feeds the C. That cushion is what stands between a rough year and a hard conversation with your examiner, and the only engine that fills it is the profit you keep. That's why a credit union watches ROA. Not to get rich. To stay strong.
The formula
Return on Average Assets = net income divided by average assets, times 100. It's annualized.
Average assets is simpler than it sounds: this period's assets plus prior year-end, divided by two. A midpoint, so a big swing in your balance sheet during the year doesn't distort the number.
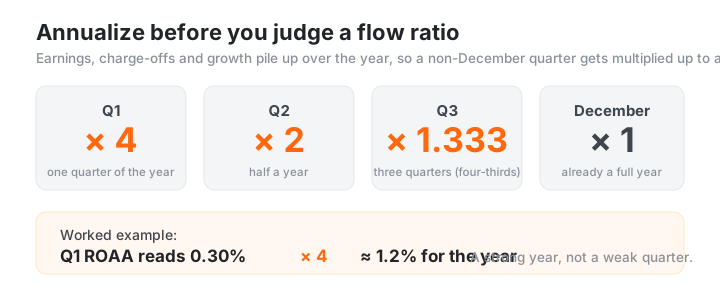
Now the trap. ROA is a flow ratio, built from income that piles up over the year and resets every January 1. So on any quarter that isn't December, the FPR annualizes it to make it comparable to a full year. Here's the multiplier, and it's worth taping to your monitor:
- Q1: times 4 (one quarter, so four of them make a year)
- Q2: times 2 (half a year)
- Q3: times 1.333 (three quarters, so four-thirds)
- December: times 1 (already a full year, leave it alone)
Do the math out loud, because that's where it clicks. Say your Q1 report shows an ROAA of 0.30%. Thin? It looks thin. But that's three months of profit. Multiply by four. That's roughly 1.2% annualized, which is a strong year, not a weak quarter.
Read a Q1 number as a quarter, not a year. Get that one thing right and every earnings ratio on the page stops lying to you.
What good looks like: around 1% is healthy, though plenty of solid credit unions run in the 0.5% to 1.0% range. There's no single right answer, and it moves with your lending mix and the rate environment.
Red flags: negative, a declining trend, or the one examiners really hunt for, profitability propped up by one-time gains. You sold a building. You booked a gain on sale. Strip those out and read what's left. Quality and trend of earnings beat a fat headline on a lucky quarter.
Levers: net interest margin (loan yield against cost of funds), fee and other income, and expense control.
How to read yours: what is a good ROA for a credit union?
You noticed the range up there is wide. Around 1%, but also 0.5% to 1.0% is fine, and it depends. That's not a dodge. It's the honest answer.
There is rarely one universal "good" number for ROA. A card-heavy credit union earns differently than a mortgage shop. A $40 million CU and a $4 billion CU carry different cost structures. So your number against the national average is close to noise. Your number against credit unions built like yours is signal.
Three habits turn ROA from trivia into a decision.
Read trends, not snapshots. One quarter is a photograph. Four quarters is a story. Is your ROAA drifting down while your peers hold flat? That's a question worth a board meeting. A single strong quarter leaning on a one-time gain? That's a mirage the trend will expose.
Compare to peers your size and lending mix. This is the whole game. Are you the standout? The laggard? Comfortably in the pack? You can't answer any of that from your own number alone.
Fix the driver, not the number. Every lever above points at a real business activity: margin, fee income, expenses. Move the driver and ROA follows honestly. Chase the number alone and you've taught yourself nothing.
This is exactly where peer comparison earns its keep, and where CU411 does the work for you. It puts your ROAA right next to the peer Average, Median, Min, and Max for credit unions your size, so you see at a glance whether you're leading or lagging your own herd.

This article is educational only. It is not financial, investment, or regulatory advice. Benchmarks here are ballparks, not bright lines. Judge your own numbers against your peers and your examiner.
See where your ROAA lands against credit unions your size in CU411. It lives on the NCUA FPR Key Ratios report; the free Quick Glance gives you a taste of the peer comparison. Want to poke at a real balance sheet first? Open Navy Federal's profile and look around.
ROA is the E in the examiner's scorecard. For the full picture, read how to read your NCUA FPR and the CAMELS Earnings letter. And ROA never travels alone: pair it with a good efficiency ratio, since expenses drive earnings, and a good net worth ratio, the cushion your earnings feed.