
Every quarter your NCUA report leads with one number, and it's the number your examiner reads first. Net worth ratio. The capital ratio. The "net cap ratio," if you came up in a shop that liked the shorthand.
It's the closest thing your credit union has to a single vital sign.
It answers one question in one number: how much cushion do you own against everything on your books? Miss it and you're guessing at your own health. Read it right and you know, before anyone tells you, whether you're standing on solid ground or a thinning ledge.
So let's read it right.
What it measures
The net worth ratio is your equity cushion as a share of everything you own. It's the money that stands between a bad year and a hard conversation with a regulator.
Net worth, in NCUA's definition, is undivided earnings plus your statutory and other reserves plus any equity acquired in mergers. On non-December cycles it also picks up undistributed net income for credit unions that haven't closed their books, and low-income credit unions may count secondary capital. Divide that by total assets and you've got the headline capital ratio every examiner starts with.
The formula
Net worth divided by total assets, times 100. That's it.
Simple to compute. Loaded with consequence. Because this is the one ratio with actual legal teeth. The Prompt Corrective Action ladder measures exactly this number.
- Well capitalized: 7% or higher
- Adequately capitalized: 6.0% to 6.99%
- Undercapitalized: 4.0% to 5.99%
- Significantly undercapitalized: 2.0% to 3.99%
- Critically undercapitalized: below 2%
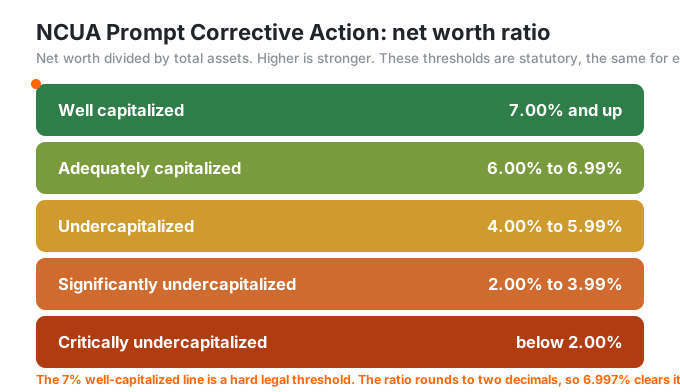
One quirk worth taping to your monitor: the ratio rounds to two decimals. So 6.997% lands at 7.00% and clears the well-capitalized bar. A rounding rule that occasionally does you a small favor. Don't build a capital plan around it.
One more note, kept short on purpose. Complex credit unions (over $500 million in assets) also face Risk-Based Capital and the simplified CCULR option, a 9% leverage ratio. That's a longer story for another page. For the vast majority of the work, the number above is the number that matters.
What good looks like: at or above 7%, holding steady or climbing. Most credit unions run comfortably above the 7% line.
Red flags: below 7%, or a falling trend even from a healthy level, especially when asset growth is outrunning your earnings. The sneaky one: shares pour in faster than you build retained earnings, so the denominator grows faster than the numerator and the ratio slides while everything feels fine.
Levers: grow retained earnings through profitability, and moderate your asset and share growth. This number moves slowly. It's an earnings-over-time story. You can't sprint it and you can't fake it.
What is a good net worth ratio for a credit union?
Here's the trap that catches good operators, and it hides inside the arithmetic.
Your net worth ratio is a fraction. Capital on top, assets on the bottom. Watch what happens when deposits surge. Members flock in, shares pile up, the denominator swells. Your capital is still climbing quarter after quarter, but the bottom of the fraction is climbing faster. The ratio slides anyway.
So the number drops while every other sign flashes green. Deposits up? Yes. Membership up? Yes. Losing money? No. Capital shrinking? Also no. And the capital ratio is still falling.
That's why one quarter's snapshot lies to you. Read the trend instead. Four quarters tells you a story a single reading never can: is your capital keeping pace with your own balance sheet, or quietly falling behind it?
And read it against the right crowd. A 7.5% ratio means one thing for a lean consumer lender and another for a shop swimming in low-yield deposits. The honest answer to "what is a good net worth ratio for a credit union?" is almost never one universal figure. It's where you stand against credit unions your size and your lending mix, tracked over time.
We built CU411 for exactly this. Pull your net worth ratio and stack it next to a peer group your exact size, with the peer Average, Median, Min, and Max sitting right beside your own number. Suddenly "is 7.4% good?" stops being a shrug. You can see whether you're leading the herd or trailing it, and whether the gap is widening.

Then fix the driver, not the number. Every lever here points at a real activity: earning more and holding it as retained earnings, or pacing your growth so the denominator doesn't swamp you. You can dress up a quarter-end balance sheet to make a ratio look prettier. Examiners know that game cold. Move the underlying business and the number takes care of itself.
Nothing here is financial or regulatory advice. The PCA thresholds are exact and legal; the read on "good" is a rule of thumb, and the right benchmark is always peers your size and mix.
Want to see where your capital cushion actually stands? Run the NCUA FPR Key Ratios on your credit union, against peers your size, in CU411. The free Quick Glance gives you a taste of the headline numbers; the full report opens the whole sheet with peer benchmarking. Prefer to poke a real one first? Open Navy Federal's CU411 profile and look around.
The net worth ratio is the Capital "C" in a CAMELS-style risk screen, and it sits at the top of your NCUA Financial Performance Report. Once you can read it, walk one door down: a good ROA for a credit union is the engine that builds this cushion, and a good delinquency ratio is one of the things that can drain it.
Read the trend. Judge against your peers. Build it slow.