

Thinking back to my first NCUA exam that I can actually remember, our CFO, Bill, kept telling me how strong our CAMEL was. I nodded along like I knew exactly what he meant. We were an international credit union, so I figured we had operations scattered across the map and, somewhere out there, apparently, a couple of camels.
We did not have camels. I was young. Give me a little grace.
Bill set me straight, and it stuck. CAMEL (the S came later) wasn't livestock. It was the scorecard the examiner used to grade us, top to bottom. And Bill could talk about ours without breaking a sweat for one simple reason: he'd already read our own numbers the way the examiner was about to. He'd read us before they ever walked in the door.
Here's the uncomfortable truth about your next NCUA exam. Your examiner walks in with a scorecard already half-formed, built from the numbers you've been filing on your Call Report every quarter. They've read you before they've met you. The only question is whether you've read yourself the same way first.
That's what this article is about. We're going to walk through CAMELS, the framework an examiner uses to size up your credit union, and the specific ratios behind five of its six letters. Then I'll show you how to put those same ratios in front of you alongside credit unions your own size.
One thing up front, because it matters and because the lawyers would like me to be clear.
This is not your CAMELS rating. NCUA examiners assign the real rating using professional judgment. It's confidential supervisory information, and your credit union is flat-out prohibited from disclosing it publicly. What we built is an unofficial, educational screen made entirely from public Call Report (5300) data. It's a mirror, not a verdict. Nobody at CUNinjas knows your rating, and neither does our software.
With that said, let's read the scorecard.
CAMELS in 60 seconds
CAMELS is an acronym, and each letter is a thing your examiner grades:
- Capital adequacy
- Asset quality
- Management
- Earnings
- Liquidity
- Sensitivity to market risk
Each component gets a score from 1 to 5. So does the overall composite. And here's the part that trips up newcomers every time: low is good. A 1 is the strongest possible mark. A 5 means critical, the kind of trouble that brings examiners back early and often. Most people's instinct says higher is better. Not here. Flip your wiring on this one.

The "S" is the new kid. For most of CAMELS history it was just CAMEL, and sensitivity to interest-rate risk lived inside liquidity. NCUA broke it out into its own letter effective 2022. So if your last exam felt like it leaned harder on rate risk than the one before it, you weren't imagining things.
Two more things to hold onto. First, the composite is not an average. Examiners don't add up the six numbers and divide. They weigh how the pieces interact, and they're allowed to consider any factor they judge relevant. No single ratio "is" your rating, and no stack of ratios is either. Second, of the six letters, our screen covers five from public data. We leave out M on purpose, and I'll explain why later (short version: you can't pull a board's judgment off a spreadsheet).
So we cover Capital, Asset quality, Earnings, Liquidity, and Sensitivity. Five of six. Here's what each one is really asking.

C: Capital adequacy
Capital is the examiner asking one blunt question. If things go sideways, can you absorb the hit?
This is the one component where the regulators handed everybody an objective, public yardstick: the Prompt Corrective Action (PCA) thresholds. They're statutory, they're not a matter of judgment, and they're the same for every credit union.
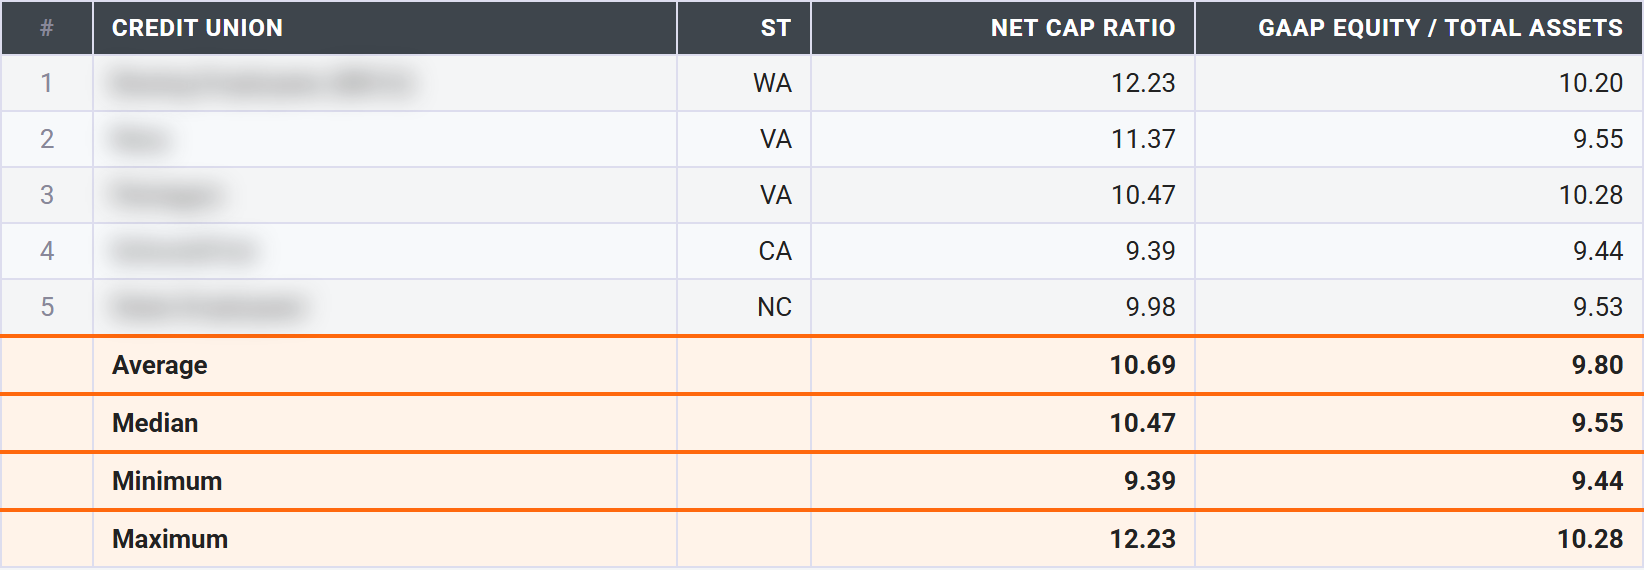
Net Worth / Total Assets (the "Net Cap Ratio")
What it measures: the size of your equity cushion relative to the whole balance sheet. The formula: net worth divided by total assets, times 100.
The PCA ladder, measured on exactly this ratio:
- Well capitalized: 7% or higher
- Adequately capitalized: 6.0% to 6.99%
- Undercapitalized: 4.0% to 5.99%
- Significantly undercapitalized: 2.0% to 3.99%
- Critically undercapitalized: below 2%
One quirk worth knowing: the ratio rounds to two decimals, so a 6.997% lands at 7.00% and clears the well-capitalized bar. Close counts here. (Complex credit unions also face Risk-Based Capital and the simplified CCULR option, which is a longer story for another day.)
What good looks like: at or above 7%, holding steady or climbing.
Red flags: below 7%, or a falling trend even from a healthy level, especially when asset growth is outrunning earnings. That last bit is the sneaky one. If shares are pouring in faster than you're building retained earnings, the denominator grows faster than the numerator and your ratio slides while everything "feels" fine.
Levers: grow retained earnings, which means profitability, and moderate your asset and share growth. Mostly, though, this number moves slowly. It's an earnings-over-time story. You can't sprint it, and you can't really fake it.
GAAP Equity / Total Assets
What it measures: your book equity, this time including accumulated other comprehensive income (AOCI). The formula: GAAP equity divided by total assets, times 100.
Why two capital ratios instead of one? Because the gap between them tells a story. GAAP equity includes unrealized gains and losses on your available-for-sale investments. Regulatory net worth doesn't. So in a rising-rate world, your bonds lose paper value, AOCI goes negative, and GAAP equity can sit noticeably below your regulatory net worth.
What good looks like: GAAP equity roughly tracking the net worth ratio.
Red flags: a big gap below the net worth ratio. That gap is unrealized investment losses showing up in plain sight, which is interest-rate risk leaking onto your balance sheet. Hold that thought. It comes back when we get to the S.
Levers: the duration and mix of your investment portfolio, and how you manage realized versus unrealized positions.
A: Asset quality
Capital asks whether you can take a punch. Asset quality asks how many punches are already on the way. It's the examiner reading the health of your loan book.
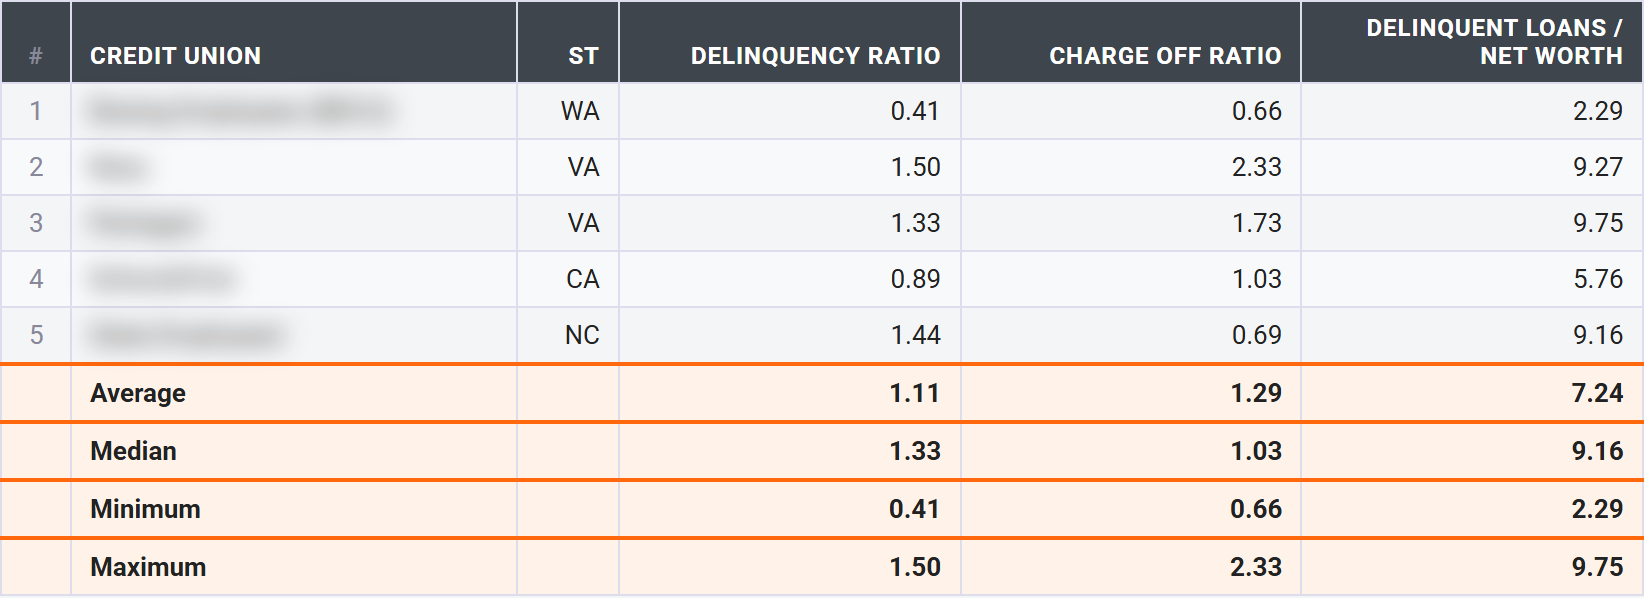
Delinquency Ratio
What it measures: the share of loans that are past due. The formula: delinquent loans (60+ days) divided by total loans.
What good looks like: low, often under 1%, though it genuinely varies by what you lend.
Red flags: a rising trend, a level above your peers, or a nasty concentration in one loan type. A 1.2% delinquency spread evenly across a diversified book reads differently than a 1.2% that's all sitting in indirect auto. Examiners notice where the problems cluster.
Levers: underwriting standards on the front end and real collections work on early-stage delinquency, backed by sensible concentration limits.
Net Charge-Offs / Average Loans (the "Charge Off Ratio")
What it measures: the loans you actually wrote off, net of what you recovered, against your average loan balance. It's annualized. The formula: net charge-offs divided by average loans, times 100.
Quick word on that annualization, because it bites people every spring. Income-statement ratios get annualized on non-December quarters: Q1 times 4, Q2 times 2, Q3 times 1.333. December is already a full year. So a charge-off ratio that looks alarming in a Q1 report reflects one quarter that the system then multiplies by four to project the full year. Don't read a Q1 number like it's a year-end number.
What good looks like: low. But "low" is relative to your lending mix. A credit-card-heavy CU runs structurally higher charge-offs than a mortgage shop, by design. Judge yourself against similar lenders, not the whole field.
Red flags: charge-offs accelerating, or your allowance (ALLL, or ACL under CECL) not keeping pace with what you're charging off. Falling reserves into rising losses is exactly the kind of mismatch an examiner circles in red.
Levers: underwriting, recoveries and collections, and pricing for the risk you're actually taking.
Delinquent Loans / Net Worth
What it measures: your problem loans stacked against your capital cushion. The formula: delinquent loans divided by net worth, times 100.
This one is a bridge between the C and the A, and examiners read it that way. It answers a single question: are your bad loans big relative to the equity you'd use to absorb them?
What good looks like: low.
Red flags: high. A pile of problem loans is one thing. A pile of problem loans that's large next to a thin capital cushion is a different, scarier thing. This is a stress signal that lives in two CAMELS letters at once.
Levers: cut delinquency (everything above) or build capital (everything in the C section). Usually both.
E: Earnings
Here's a thing people forget. Earnings aren't about getting rich. For a credit union, earnings are the only real way you build capital over time. No profit, no retained earnings, no growing cushion. The E feeds the C.
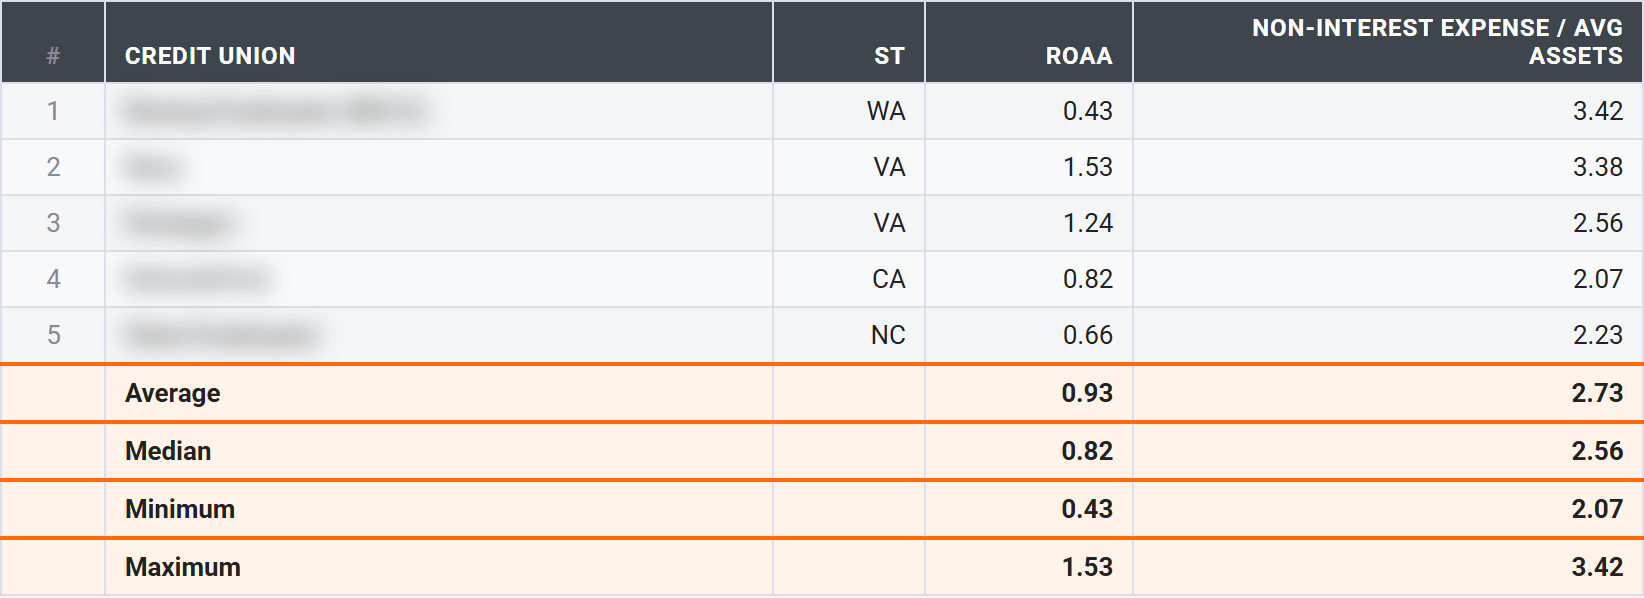
Return on Average Assets (ROAA)
What it measures: net income against your average assets, annualized. The headline profitability number. The formula: net income divided by average assets, times 100.
What good looks like: around 1% is healthy, though plenty of solid CUs run in the 0.5% to 1.0% range. There's no single right answer.
Red flags: negative, a declining trend, or, and this is the one examiners really hunt for, profitability propped up by one-time gains. You sold a building. You booked a gain on sale. Strip those out and what's left? Examiners want the quality and trend of earnings, not just the headline number on a good quarter.
Levers: your net interest margin (loan yield against cost of funds), fee and other income, and expense control.
Non-Interest (Operating) Expense / Average Assets
What it measures: what it costs to run the place, relative to your size, annualized. The formula: non-interest expense divided by average assets, times 100.
What good looks like: lower, with around 3% as a common ballpark. Smaller CUs run higher here. Scale genuinely helps with this one, and there's no shame in a $40 million CU costing more to run per dollar than a $4 billion one.
Red flags: the ratio rising while assets stay flat, or sitting well above similar-size peers. Flat assets and climbing costs is a margin getting squeezed in slow motion.
Levers: scale and efficiency, your branch-versus-digital cost structure, and your vendor contracts. One caveat, and I mean it: this is about efficiency, not slash-and-burn. Cut too hard and you starve the service and the growth that fund your future. The goal is a leaner operation, not a hollow one.
L: Liquidity
Liquidity is the examiner asking whether you can pay people when they want their money. Members don't schedule withdrawals around your convenience.
Total Loans / Total Assets
What it measures: how much of your balance sheet is tied up in loans, which are the least liquid thing you own. The formula: total loans divided by total assets, times 100.
What good looks like: a healthy middle, commonly 60% to 80%.
Red flags: very high means thin liquidity, and real funding pressure if shares start running off. Very low is the opposite problem: money sitting in cash and low-yield investments instead of working in loans, dragging your earnings. Both extremes hurt, just in different letters.
Levers: loan demand and origination, deposit strategy, and honest balance-sheet planning.
Cash & Short-Term Investments / Assets
What it measures: your liquid buffer for withdrawals and obligations. The formula: cash and short-term investments divided by total assets, times 100.
What good looks like: enough to cover the outflows you can plausibly see coming.
Red flags: too low is obvious liquidity risk. Too high, again, is an earnings drag. There's a Goldilocks zone, and it depends on your members and your funding.
Levers: your liquidity policy, funding lines like the FHLB, and laddering your investment maturities.
S: Sensitivity to market risk
The newest letter, and the one that punished a lot of balance sheets when rates jumped. Sensitivity asks how much your earnings and your net worth move when interest rates move.
Net Long-Term Assets / Total Assets (our proxy)
What it measures: how much of your balance sheet sits in long-duration assets: long-term real estate loans, certain commercial loans, investments maturing past three years, fixed assets. The more long-duration you hold, the more your value swings when rates swing. The formula: net long-term assets divided by total assets, times 100.
What good looks like: lower means less rate sensitivity. North of 30% earns a closer look. How much closer depends on your strategy.
Red flags: high and rising while rates are climbing. That's the trifecta nobody wants: margin compression, falling economic value, and unrealized losses on your AFS book. Remember that GAAP-versus-net-worth gap up in the Capital section? This is where it comes from. The letters talk to each other.
Levers: shorten asset duration, lean toward variable-rate and shorter loans, and sell long fixed-rate mortgages into the secondary market.
Now the honest caveat. Our column is a Call Report proxy. The official S assessment uses NCUA's Net Economic Value (NEV) and the Estimated NEV Tool, which models how your equity value shifts under rate shocks. That's not in the Call Report, so we can't show it. Our number points you in the right direction. It is not the official measure. Treat it as a smoke detector, not a thermometer.
Why we leave out M
Five letters, five sections. Where's Management?
Left out, on purpose, and I'd rather tell you that straight than fake it.
M is the most subjective component in CAMELS, and there's a good reason: it's qualitative. Board oversight. Internal controls. Succession planning. Strategy. The quality of your compliance program. The depth of your management bench. None of that has a Call Report line item. You can't pull a board's judgment off a 5300.
So we don't invent an M score, and we don't compute a fake composite. Anybody selling you a tidy "your CAMELS is a 2.3" off public data is selling you something that doesn't exist. M is the examiner sitting across from your CEO, reading the room, reading the minutes, reading how you answer the hard question about that indirect auto trend. We can't screen for that. Nobody can.
How to use this before your next exam
So you've got five letters' worth of ratios. What do you actually do with them?
Read trends, not single points. One quarter is a snapshot. Four quarters is a story, and examiners read the story. A 7.1% net worth ratio means something very different on the way up than on the way down.
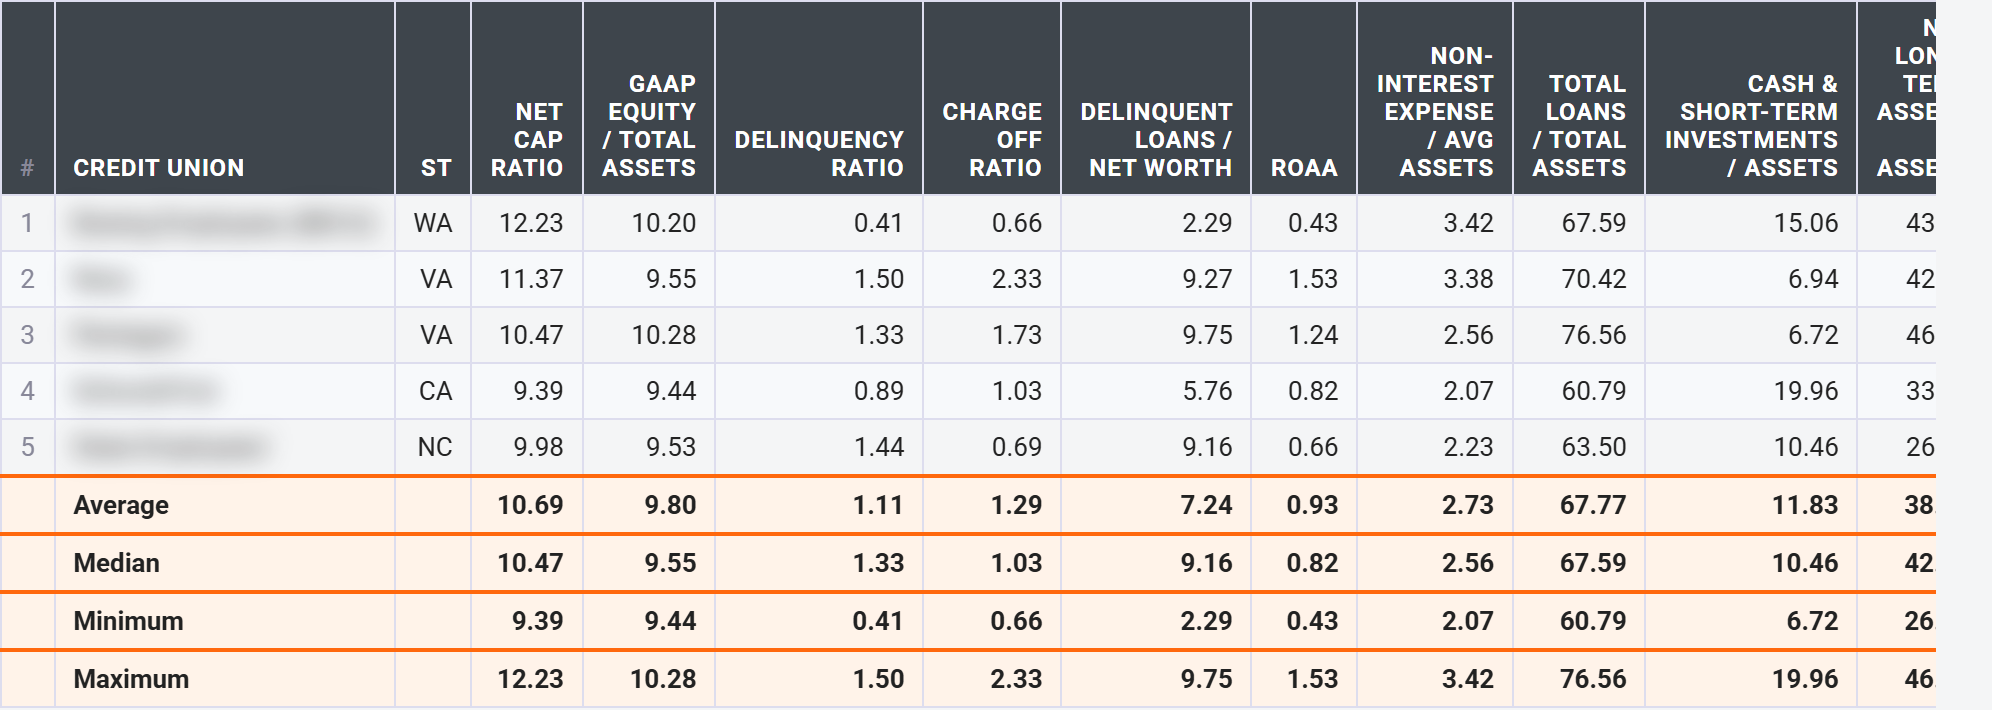
Compare to peers your size. This is the whole game, and it's where our screen earns its keep. A 3% operating expense ratio is great for a $4 billion CU and totally normal for a $40 million one. Your number against the national average is noise. Your number against credit unions built like yours is signal. The screen shows you the peer Average, Median, Min, and Max right next to your own figure, so you can see at a glance whether you're the standout, the laggard, or comfortably in the pack.
Fix the driver, not the number. This is the one I'd tattoo on the wall if I could. Some ratios can be cosmetically managed. Dump some assets at quarter-end, flatter a ratio for a reporting date, feel clever. But examiners look at trends, quality, and how the pieces interrelate, and they notice the window-dressing.
Worse, the window-dressing is itself a red flag. Every "lever" in this article points at a real business driver: underwriting, margin, efficiency, duration. Move the driver and the number follows honestly. Chase the number alone and you've just taught your examiner you'll chase numbers.
And remember the composite weighs everything at once. The six letters talk to each other (you saw it three times in this piece: capital and asset quality in the delinquency-to-net-worth ratio, capital and sensitivity in the GAAP-equity gap, earnings feeding capital). An examiner reads the whole conversation. So should you.
Bill could talk about our CAMEL without flinching because he'd done the homework, not because he had the thickest binder in the room. He'd read our own numbers honestly, the way the examiner would.
You can do the same, and you don't need to tell a camel from a dromedary to start. Pull up your own credit union, line your five letters up against peers your size, and find the one trend you'd least like to explain across the table. Then go fix the driver behind it. You've got a quarter or two before anyone knocks. That's plenty of time, if you start this week.
This article is educational only. It is not financial, investment, or regulatory advice, and the CAMELS-Style Risk Screen is not your official CAMELS rating, which is confidential and which NCUA examiners assign. Consult your own advisors and your examiner.
Run the CAMELS-Style Risk Screen on your own credit union in CU411. It's a Sensei feature; the free Quick Glance gives you a taste of the peer comparison. → Open the CAMELS-Style Risk Screen
CAMELS is the lens your examiner looks through. The full report card is the NCUA Financial Performance Report. → How to read your NCUA FPR
Want to see it on a real balance sheet first? → Browse a credit union profile
Going deeper on a single ratio? Each has its own plain-English explainer: a good net worth ratio, a good ROA, a good efficiency ratio, a good loan-to-share ratio, and a good delinquency ratio.