
Every quarter the whole industry files its homework with the regulator, and every quarter somebody asks how we did against each other. That's fine, but how did we do against the banks?
Most "credit unions vs banks" numbers you'll see this quarter are built wrong. Somebody grabs a credit union's after-tax return and parks it next to a bank's after-tax return and calls it a match. It isn't. One of them pays federal income tax and one of them doesn't, so that column is scoring the tax code as much as the business. Do that and the comparison lies to you before you've finished pouring your coffee. (We wrote the whole rulebook on this. See how to compare a credit union to a bank the fair way for the four rules that keep the table honest. This piece just runs the actual numbers through them.)
So here's the deal with this series. Once a quarter, when the call reports land, we line up every credit union against the banks the fair way. Pre-tax earnings against pre-tax earnings. Capital cushion against the closest capital cushion, with the labels straight. Growth against growth. And we tell you what the data says, not what a trade group wishes it said.
First edition. The Q1 2026 filings are in. Let's read them.
Who is even in this fight
Start with the roster, because the sizes surprise people.
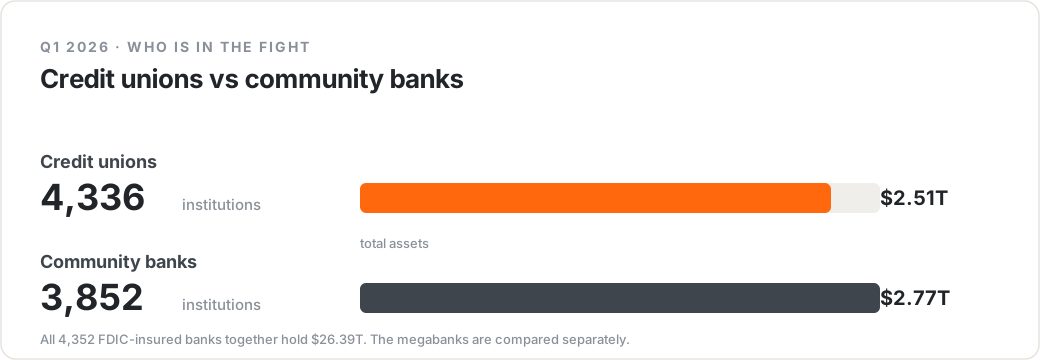
At the close of Q1 2026, 4,336 credit unions filed a call report with the NCUA. Together they hold about $2.51 trillion in assets.
On the other side, 3,852 community banks filed with the FDIC (that's the FDIC's own "community bank" flag, the local institutions that actually compete with you, not the Wall Street giants). Together they hold about $2.77 trillion.
Sit with that a second. There are more credit unions than community banks in the country now, and the two groups hold almost the same pile of assets. The credit-union movement, the thing people still call "small," is a $2.5 trillion peer to community banking. Not a rounding error. A rival.
If you widen the lens to all 4,352 FDIC-insured banks, including JPMorgan and the rest, the asset total jumps to about $26.39 trillion. So the megabanks are a different planet, and that's exactly why this scorecard compares you to community banks and calls the big banks out separately. Sizing your credit union against JPMorgan tells you nothing. Sizing it against the community bank on Main Street tells you everything.
One number worth flagging before we move on. That 4,336 credit-union count is down from 4,505 a year ago. The count keeps sliding, quarter after quarter, and it isn't failures. It's mergers. The industry is consolidating into fewer, bigger cooperatives. Your peer group is literally shrinking under you, which is one more reason to know exactly where you stand in it.
Earnings: read it pre-tax, and read the fine print
Here is where a lazy comparison does the most damage, so here is where we're most careful.
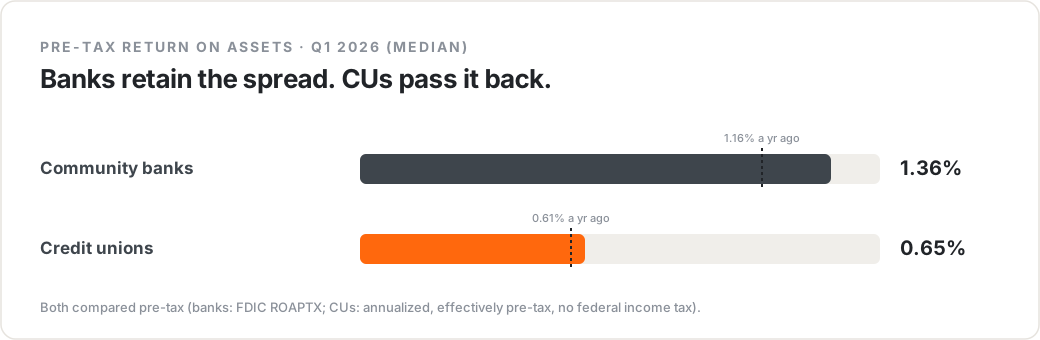
The typical (median) community bank posted a pre-tax return on assets of 1.36% in Q1 2026, up from 1.16% a year earlier. The typical credit union earned an annualized 0.65%, on a basis that's effectively pre-tax already, since your credit union pays no federal income tax. A year ago that CU figure was 0.61%, so both sides ticked up. Both are healthier than they were last spring.
Now do not run screaming from that gap. Read the fine print first, because two things are going on.
First, the honest basis. We're comparing pre-tax to pre-tax on purpose, using the FDIC's ready-made pre-tax return (ROAPTX) so nobody's tax bill contaminates the number. That part is clean.
Second, and this is the one people skip: a credit union isn't trying to maximize return on assets. A bank answers to shareholders who want the number as high as it goes. Your credit union answers to members, and a chunk of what a bank would book as profit, you hand back as better loan rates, better deposit rates, and lower fees. A "lower" ROA at a credit union often isn't weakness. It's the mission spending money on purpose. The bank keeps the spread. You give it away. That's the whole point of the cooperative, and it shows up right here in the earnings line.
So the fair read isn't "banks earn more, credit unions lose." It's "banks are built to retain the spread, credit unions are built to pass it through, and the pre-tax numbers show exactly that trade in action."
One caveat we won't hide. Q1 is a single quarter, and we annualized the credit-union figure by multiplying it by four to put it on the same yearly footing as the bank number. One quarter times four is a fair estimate, not a crystal ball. A rough January can drag the whole annualized figure down, and a strong Q4 later can pull the full-year number back up. Treat the 0.65% as a first read on the year, not the verdict.
And a real one. Roughly 15% of credit unions posted a loss in Q1 2026 (net income at or below zero for the quarter). That's a meaningful slice, it's worth watching, and it's the kind of thing a median politely hides. Half the room is above the median and half below, and right now about one in seven is underwater for the quarter. If that's you, you are very much not alone this quarter.
Capital: credit unions carry the thicker cushion
Now the good news, and it's not close.
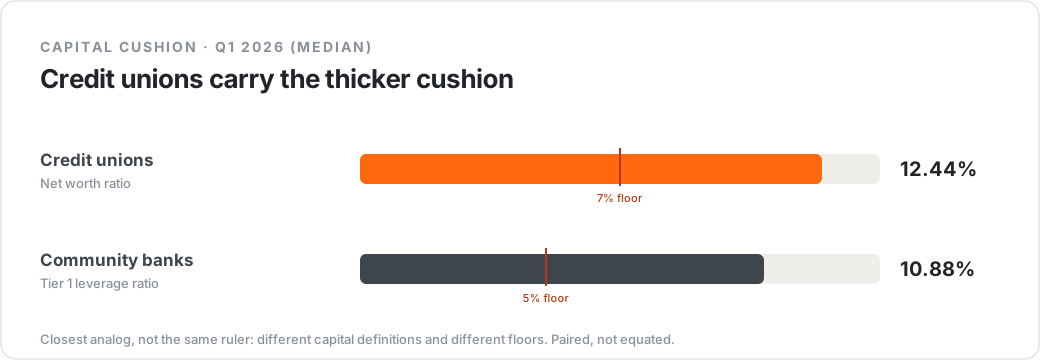
Capital is the shock absorber, the cushion between a bad year and a regulator's phone call. The typical credit union carried a net worth ratio of 12.44% at the end of Q1 2026, up from 12.01% a year ago. Under Prompt Corrective Action, 7% makes you well capitalized. The median credit union is sitting on nearly double the floor.
The closest bank measure is the Tier 1 leverage ratio, and the typical community bank posted 10.88%, up a touch from 10.73% a year earlier. Well capitalized for a bank starts at 5%.
Read those two carefully, because they are the closest analog, not the same ruler. Different definitions of what counts as capital, and different regulatory lines (7% for you, 5% for them). We pair them, we don't equate them, and the comparison rulebook walks through exactly why. But even accounting for the mismatch, the picture is clear: credit unions are running heavier capital cushions than community banks, and both groups built cushion over the past year. That's the cooperative model doing what it's supposed to do. You don't raise capital from the stock market. You earn it and keep it, member by member, year after year, and it stacks up.
If your board ever needs one slide that says "we are safe," this is the line. Your capital cushion isn't just above the regulatory floor. It's above the bank across the street's, on the closest measure we've got.
Growth: banks pulled in deposits faster this quarter
Here's one that goes the other way, and it's worth being honest about.
Over the year ending Q1 2026, the typical credit union grew its shares (deposits) by 2.36%. The typical community bank grew its deposits by 3.96%. Same rough idea on both sides (shares are the credit-union word for deposits), and this quarter the banks pulled ahead.
That's not a disaster, but it's a signal. Deposits are the raw material. Slower share growth this year means members parked money somewhere else, or a competitor down the block offered a rate you didn't match, or people are simply spending more of what they've got. A 1.6-point gap in a single year is the kind of thing that compounds if you ignore it. Whoever grows the deposit base grows the ability to lend, and right now community banks are winning that specific race.
Do the math on why it matters. Deposit growth feeds loan growth feeds earnings. Lose the top of that funnel for a few years running and the whole thing narrows. This is the number to take back to your board and ask one blunt question about: are we competing hard enough for the deposit, or are we assuming loyalty does the work rate does?
Credit quality: nearly everyone's loan book is clean right now
We save credit quality for a careful last, because it's the metric people botch most often.
The tempting move is to line up your delinquency ratio against the bank's and declare a winner. Don't. Credit unions count loans 60-plus days late. Banks count 90-plus days plus a whole extra category (nonaccrual) that credit unions don't even report. Those are different rulers wearing the same word, and the rulebook explains why crossing them is a trap.
So we lead with the one credit-quality number defined the same way on both sides: net charge-offs, the loans actually written off net of recoveries. And the headline for Q1 2026 is almost boring in a good way. The typical community bank's net charge-off ratio rounds to 0.00%. Not a typo. Nearly half of all community banks (about 49%) charged off nothing at all, or recovered more than they lost, in the quarter. When half the group is at zero, the median lands at zero.
That "0.00% median" is honest but it's also fragile, so we won't wave it around as a trophy. The more useful read is the asset-weighted figure, which lets the bigger institutions count for more: across community banks, net charge-offs ran about 0.18% of loans in Q1 2026. Still low. Loan books, on both sides of the aisle, are clean right now. Credit stress is not the story this quarter.
We're deliberately not slapping a single "CU net charge-off vs bank net charge-off" trophy on this section, because the reporting windows don't line up cleanly quarter to quarter (the credit-union figure often reflects the prior year while the bank figure is current year-to-date). Same ruler, slightly different stretch of time. When the windows genuinely match, we'll call the head-to-head. This quarter the honest finding is simpler and just as useful: charge-offs are near the floor across the whole industry, banks and credit unions alike. Enjoy it while it lasts.
Two facts the data coughed up
A couple of things fell out of the Q1 2026 numbers that are too good to leave in a footnote.
The median credit union out-earns one in six community banks, pre-tax. Take that typical credit union's annualized 0.65% and ask how many community banks earned even less than that on a pre-tax basis. Answer: 16.4% of them. So the "credit unions barely break even" story has a hole in it. A perfectly ordinary credit union, the one sitting dead-center of the pack, is more profitable pre-tax than roughly 630 community banks. Not the strongest credit unions. The median one.
Texas is the whole country's battleground. It leads both rosters: 380 credit unions and 315 community banks, more of each than any other state. After that the two maps split hard. Community banks cluster through the farm belt (Illinois, Iowa, Minnesota, Kansas, Missouri all crack the top ten), a legacy of a thousand small ag-town charters. Credit unions cluster where the people are (Pennsylvania, New York, California right behind Texas). So depending on your state, "the bank across the street" is either everywhere or nearly extinct, and your competitive map looks nothing like the one two states over.
What Q1 2026 actually says
Line it all up and the quarter tells a coherent story.
Credit unions are safer and banks are, on paper, more profitable, and both of those are the model working exactly as designed. You carry a thicker capital cushion (12.44% net worth ratio against a 10.88% Tier 1 leverage) because you keep what you earn instead of paying it out to shareholders. You post a lower pre-tax return (0.65% annualized against 1.36%) because you hand the spread back to members as rates and fees instead of banking it as profit. Community banks grew deposits faster this year (3.96% against 2.36%), which is the one flashing light worth staring at. And credit is clean nearly everywhere, so nobody gets to hide behind loan losses this quarter.
None of that is a reason to feel good or bad in the abstract. It's a reason to find out where your credit union sits inside these numbers, because the median is just the middle of a very wide room.
This is exactly what CU411 does with the same call-report data. The free "You vs. the banks next door" strip on Quick Glance drops your own credit union next to the median of the community banks right around you, using pre-tax earnings, the capital cushion, and net charge-offs the fair way, with the peer names blurred. Turn on "Include banks" on a full report and those local banks slot in as their own labeled block, honest daggers and "n/a (banks)" cells and all. The rules from the comparison rulebook run in the background. You just read your table instead of the industry's.
We'll be back next quarter with the Q2 2026 numbers and a fresh read. The rosters will have shifted, the deposit race will have moved, and somebody will still be trying to compare after-tax returns and calling it fair. Not us. See you then.
This article is educational only. It is not financial, investment, or regulatory advice. All figures are medians (unless noted) computed from Q1 2026 NCUA and FDIC call-report data, on the fair-comparison basis described above and in our comparison rulebook. Credit-union earnings are shown on an annualized, effectively pre-tax basis; bank earnings use the FDIC pre-tax return (ROAPTX). "Community banks" means the FDIC community-bank flag. Confirm any regulated figure against the primary source and consult your own advisors.
Sources: NCUA 5300 Call Report data (credit-union figures, Q1 2026 and Q1 2025); FDIC public bank data via the BankFind Suite (api.fdic.gov/banks), community-bank flag and pre-tax return on assets, Q1 2026 and Q1 2025.
See where your credit union sits in the Q1 2026 numbers. The free "You vs. the banks next door" strip on CU411's Quick Glance runs this exact comparison for your own credit union against the community banks nearby. → Open CU411
Want the methodology? Every rule behind this scorecard, and why we compare pre-tax, lead with net charge-offs, and pair capital cushions carefully, lives in the pillar. → How to Fairly Compare Your Credit Union to a Bank