
The first time I found the FDIC data, I was at a small Credit Union in New England. I wanted to see how our credit union stacked up against the bank across the street. I pulled both institutions' numbers, dropped them into one spreadsheet, lined the ratios up, and felt pretty smart about it.
The spreadsheet lied to me. It just did it politely.
Not because the numbers were wrong. Every figure was a real regulator-reported number, straight off the public filings. The problem was subtler and worse. Two of the columns I'd parked next to each other weren't actually measuring the same thing, so the "comparison" was really two different rulers pretending to be one.
A CU and a bank fill out different forms, on different schedules, under different regulators, for owners who want different things. Credit unions file the NCUA 5300 Call Report. Banks file the FFIEC Call Report, which shows up in FDIC data. Line those two up naively and the mismatches don't announce themselves. They just quietly tilt the table.
So this article is about the four rules that keep the table honest. Follow them and you can put your credit union next to the bank down the block and trust what you see. Skip them and you'll draw confident conclusions from a comparison that was rigged before you started, usually against yourself.
Let's fix that.
Why this comparison matters now
Credit unions are buying banks. There were 22 CU-bank acquisition deals in 2024 and 16 in 2025, and the trend hasn't cooled. The tax-exemption fight in Washington gets argued with FDIC-versus-NCUA numbers on both sides. Your board wants to know how you're holding deposit share against the bank two exits down. Every one of those conversations runs on a credit-union-to-bank comparison, and every one of them goes sideways if the comparison isn't built right.
You don't need a subscription to do this. FDIC bank data is public, free, and downloadable (the BankFind Suite at api.fdic.gov/banks serves it back to 1984). The data isn't the hard part. Comparing it fairly is. That's where these four rules come in.
Rule 1: Compare earnings pre-tax
Start with the biggest, quietest distortion of them all: taxes.
Your credit union pays no federal corporate income tax. That's the deal cooperatives struck a long time ago, and it's not up for debate on a spreadsheet. Banks, most of them, do pay it. So if you compare your return on assets against a bank's after-tax return on assets, you're not comparing operating performance. You're comparing operating performance plus a tax bill only one of you has to pay. The bank's number comes in artificially low, and yours looks like a hero by default.
Now flip it, because there's a second wrinkle that pushes the other way. A big chunk of community banks are organized as Subchapter S corporations, which pass their income straight through to shareholders instead of paying tax at the company level. About 38% of community banking organizations carried a Subchapter S election as of September 30, 2024 (that's the Federal Reserve Bank of Kansas City's community banking bulletin). For those banks, the after-tax ROA on the filing reads high, because the company itself paid little or no income tax. The tax got handed to the shareholders instead.
So a raw after-tax ROA column is wrong in both directions at once. It flatters your credit union against a normal C-corp bank, and it flatters a Sub-S bank against everybody. Read the math out loud and it's almost funny. You'd be scoring three institutions on a "profitability" number where one of them (yours) skips the tax, one of them (the C-corp) eats it, and one of them (the Sub-S) shoves it out the back door to its owners. That's not one ruler. That's three.
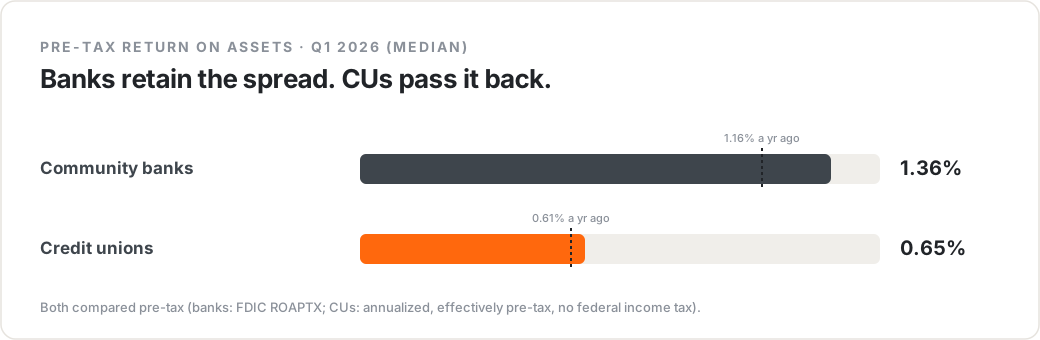
The fix is clean, and you don't have to invent anything. FDIC publishes pre-tax ROA ready-made. The field is called ROAPTX, and it strips the tax question out of the picture entirely. Compare your ROA against the bank's pre-tax ROA and you're finally measuring the same thing: how well the balance sheet earns before the government takes its cut.
If that feels like putting a thumb on the scale, it isn't, and you're in good company. The FFIEC's own Uniform Bank Performance Report, the analytical report bank examiners live in, substitutes an estimated income tax so it can compare Sub-S and C-corp banks on equal footing. The regulators already decided that a fair earnings comparison has to neutralize the tax difference. We just do it the honest way: use the pre-tax number FDIC already computed, rather than estimating a tax ourselves.
One line to tape to your monitor: compare earnings pre-tax, and never make up your own tax adjustment. Use the pre-tax figure the regulator already publishes.
Rule 2: Never cross delinquency definitions
Credit quality feels like it should be easy to compare. Everybody tracks bad loans, right? Sure. They just don't count them the same way, and the headline delinquency numbers on each side are not the same metric wearing different clothes. They're different metrics.
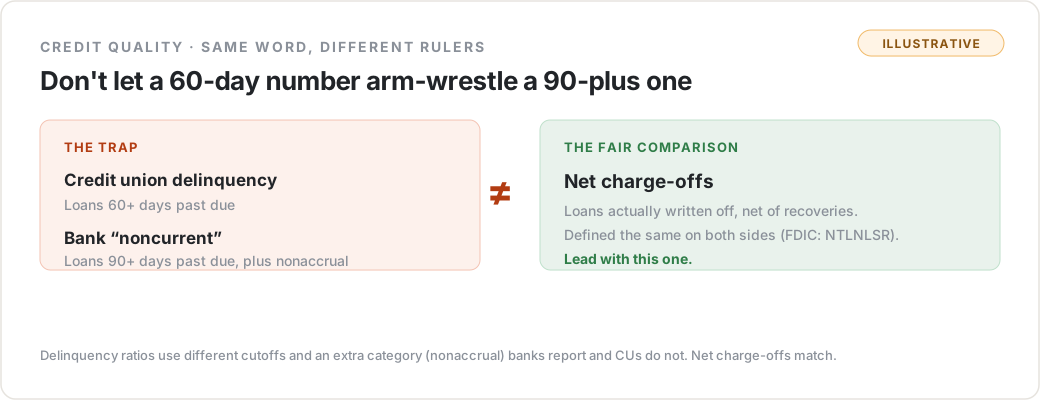
NCUA's headline delinquency ratio counts loans that are 60 or more days past due. That's the number on your 5300, the one your examiner reads, the one you quote in a board meeting.
The bank's headline credit-quality ratio, the "noncurrent" ratio, counts loans that are 90 or more days past due plus loans on nonaccrual status. Nonaccrual is a bank accounting status that says "we've stopped booking interest on this loan because we don't expect to collect it." Credit unions don't report nonaccrual at all. It isn't a line on the 5300.
So the two ratios differ on both ends. Different aging cutoff (60 days versus 90), and a whole extra category (nonaccrual) that exists on one side and not the other. Put your 60-plus-days number next to the bank's 90-plus-and-nonaccrual number and call it a delinquency comparison, and you've compared nothing. You've just made two real numbers look like rivals when they were never even on the same field.
This isn't a small footnote. It's the reason your loan book can look cleaner or dirtier than the bank's purely as an artifact of definitions, before a single actual loan enters the picture.
So what do you do? You lead with the one metric that is defined the same way on both sides: the net charge-off ratio. Net charge-offs are the loans an institution actually wrote off, minus what it recovered, measured against average loans. Credit unions compute it. Banks compute it (FDIC calls it NTLNLSR). Same numerator concept, same denominator concept, same idea. It's the loans you truly lost, not the loans that are merely late.
One honest caveat so nobody gets surprised. The window can differ even when the definition doesn't. The credit-union charge-off figure often reflects the prior calendar year, while the bank figure is the current year-to-date annualized. Same ruler, slightly different stretch of time. Note it and move on. That's a rounding-error problem next to the 60-versus-90-plus-nonaccrual chasm you just avoided.
Lead credit quality with net charge-offs. Show delinquency separately if you must, and never let a 60-day number arm-wrestle a 90-plus-nonaccrual number. They're not opponents. They're strangers.
Rule 3: Watch the capital labels
Capital is the shock absorber. It's the cushion that stands between a bad year and a regulator's phone call, on both sides of the aisle. So you'd think capital ratios would line up cleanly. They almost do. Almost.
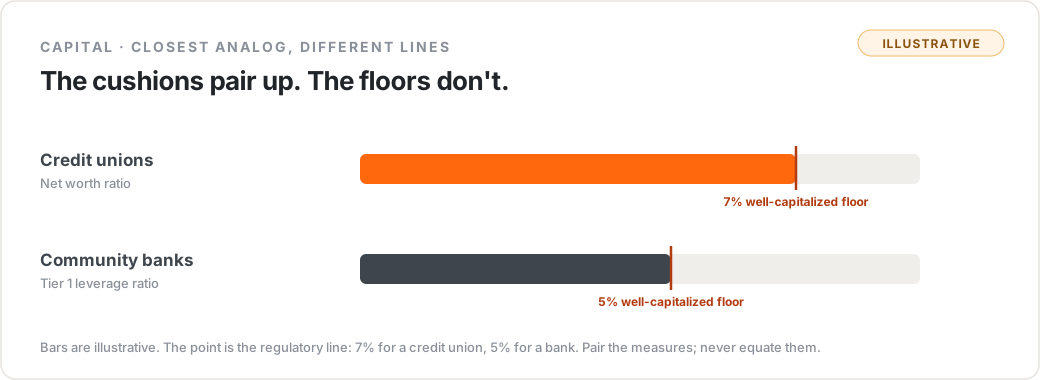
The credit-union headline capital measure is the net worth ratio: net worth divided by total assets. It has legal teeth. Under Prompt Corrective Action, 7% or higher is well capitalized. That threshold is statutory, it's the same for every credit union, and it's the number your capital story lives and dies by.
The closest bank analog is the Tier 1 leverage ratio: Tier 1 capital divided by average assets. It's also a capital-cushion measure, it's also expressed as a percentage of assets, and it also has a regulatory threshold. But that threshold is 5% for a well-capitalized bank, not 7%.
Read those two side by side without knowing the labels and you'd conclude the bank is running dangerously thin: "They're at 8.5% and we're at 10.2%, so we've got way more cushion." Maybe you do. But part of that gap is just that the two regimes draw their "well capitalized" line in different places, and the two ratios don't define their numerators identically either. The net worth ratio and the Tier 1 leverage ratio are the closest cushion analog you'll find. They are not the same measurement, and they are absolutely not the same threshold.
So pair them, don't equate them. When you drop net worth ratio next to Tier 1 leverage, flag it as the closest match and remember the bars sit at different heights (7% for you, 5% for them). It's a fair comparison of "how thick is each institution's cushion," told with an asterisk. Treat it as an identity and you'll misjudge who's actually stronger.
Net worth ratio pairs with Tier 1 leverage as the closest capital-cushion analog. Different definition, different threshold. Pair it, label it, don't call it the same number.
Rule 4: Mind what does not map
The first three rules fix comparisons that can be made fairly with a little care. This last rule is about knowing when to stop, because some things on your Call Report have no honest bank equivalent at all, and forcing them is worse than leaving them blank.
Members. A credit union is owned by its members. A bank is owned by its shareholders. Banks report no membership figure, because they have none. So every per-member metric you love (members per employee, average member relationship, share draft penetration, membership growth) has no bank column to sit next to. Not a small one. Not an estimate. None. The honest thing is to render that cell as "n/a (banks)" and leave the bank out of any math on it. Slot a zero in there and you've invented a fact. Blend it into a median and you've poisoned the median.
When you still want a productivity comparison across the two, switch to a denominator both institutions actually report. Per-employee and per-branch figures work, because banks report employees and offices too. "Assets per employee" or "loans per branch" you can compare. "Members per anything" you cannot. Reach for the shared denominator, not the invented one.
Cost of funds. This one is sneakier, because the number does exist on both sides, so it's tempting to score it like any other expense. Don't, or at least not the way you'd score it for a bank. For a bank, a low cost of funds is unambiguously good: cheap deposits, fat margin, happy shareholders. For a member-owned cooperative, a higher cost of funds can mean you're paying your members better dividends, which is the entire point of the institution. That's the mission working, not a problem to fix.
So cost of funds cuts both ways for a credit union, and you should not slap a red flag on a "high" figure the way a bank analyst would. Show the number, compare it if it's useful, but don't score its direction like it's pure expense. (There's a small basis wrinkle too: the credit-union figure is typically measured over average assets while the bank figure runs over average earning assets, so the bank number tends to read a touch higher. Worth a footnote, not a fight.)
Some things just don't map, and the honest move is to say so out loud rather than fake a number to fill the cell. N/a is a finding, not a failure.
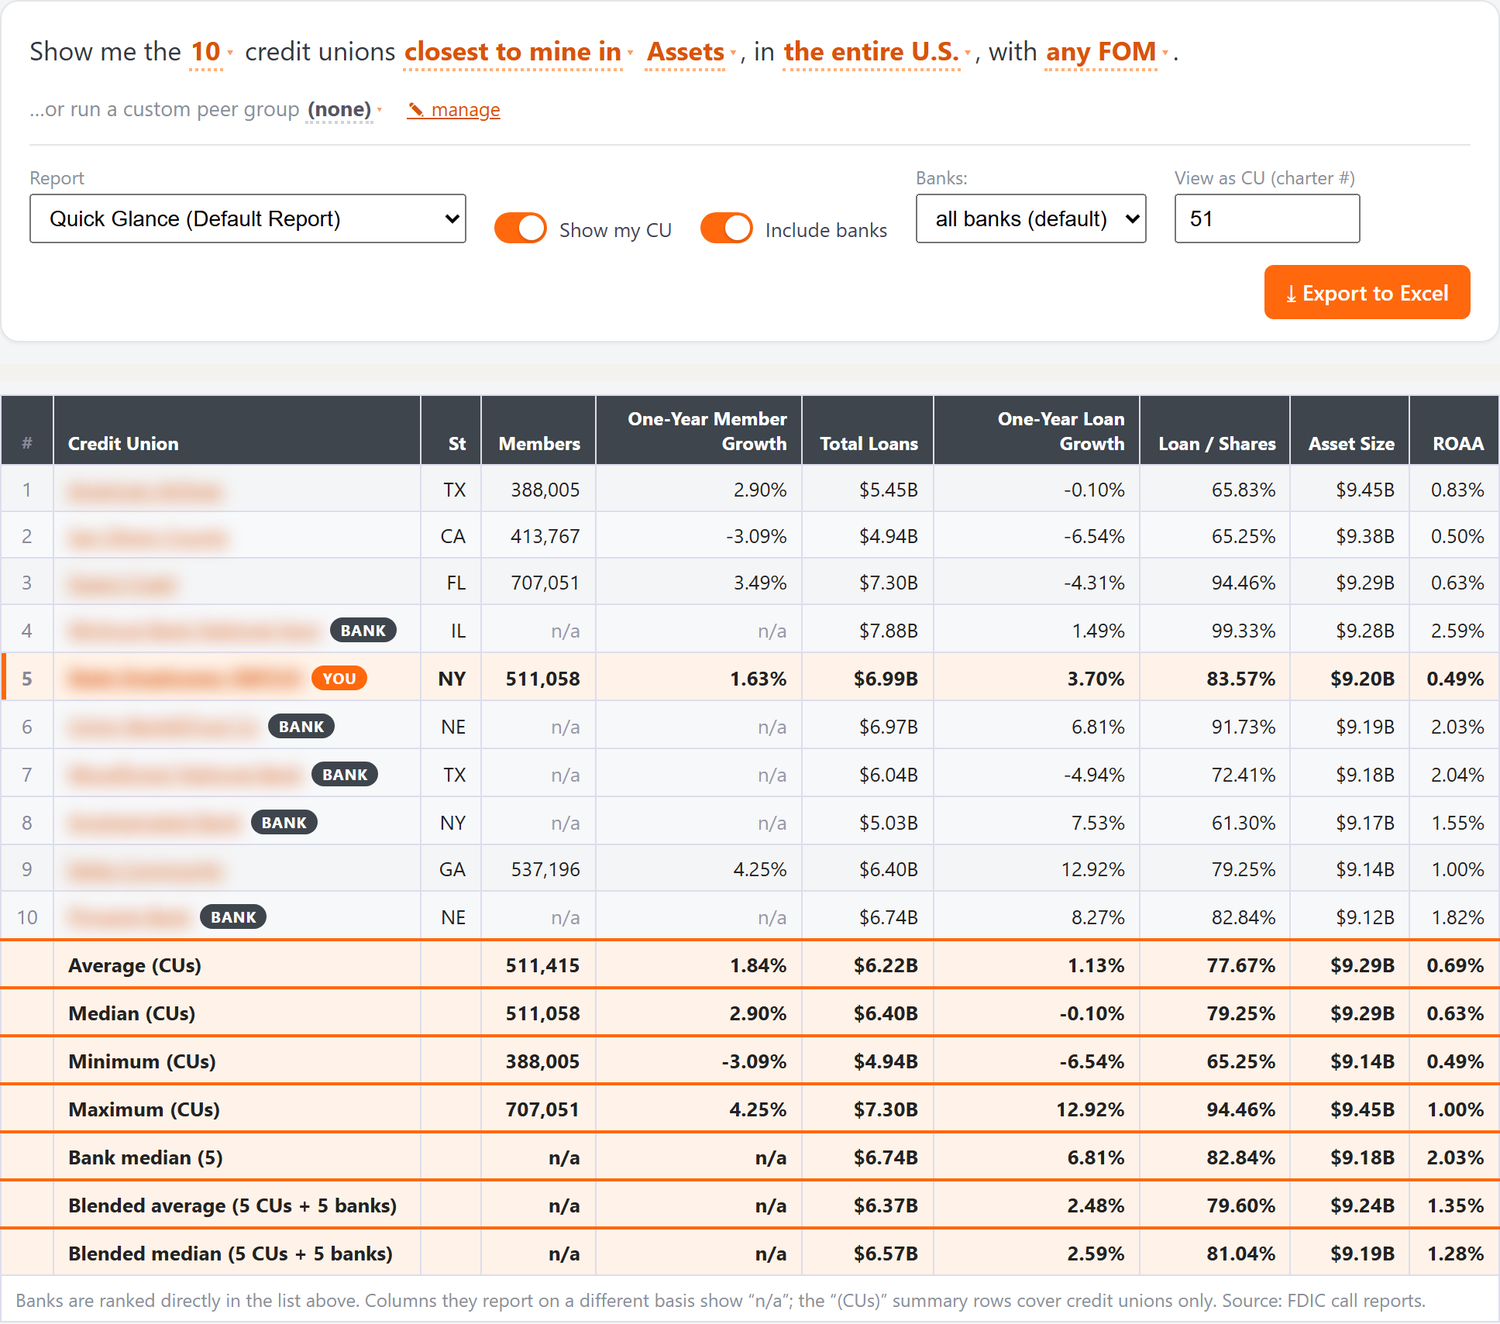
Put the four rules on one table
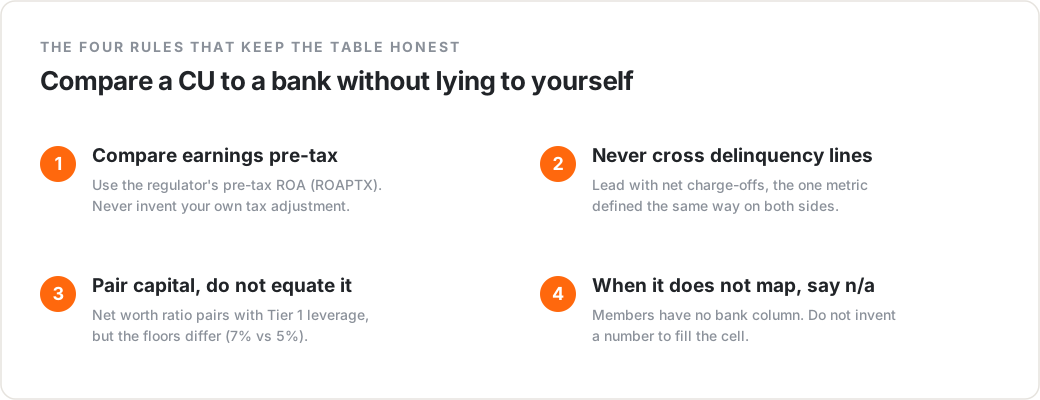
Here's the whole discipline in one breath. Compare earnings pre-tax. Lead credit quality with net charge-offs and never cross delinquency definitions. Pair capital cushions (net worth ratio to Tier 1 leverage) as a close match, not an identity, and mind the different thresholds. And when something (members, most of all) doesn't map, say "n/a" instead of inventing a number.
Do all four and the bank across the street becomes a fair yardstick instead of a funhouse mirror. Skip any one of them and you'll walk into a board meeting, or a merger conversation, or a tax-fight op-ed, holding a comparison that was tilted before you sat down.
This is exactly the discipline we baked into CU411's bank comparison, so you don't have to remember it every time. The free "You vs. the banks next door" strip on Quick Glance already shows your credit union against the median of same-size community banks nearby, using pre-tax ROA, net charge-offs, and capital cushion the fair way, with cost of funds shown but deliberately not scored. Turn on "Include banks" on a full report and the banks slot in as their own labeled block: real values where the metrics map, a dagger and a plain-English basis note where the bases differ, and an honest "n/a (banks)" on the member rows. The rules run in the background. You just read the table.
Strip out every CU411 mention and these four rules still stand on their own. That's the point. The tool doesn't make the comparison fair. You make it fair by following the rules. The tool just remembers them for you.
This article is educational only. It is not financial, investment, or regulatory advice. Benchmarks and thresholds are described as rules of thumb and regulatory definitions current as of writing. Confirm any regulated figure against the primary source and consult your own advisors.
Sources: FDIC BankFind Suite (api.fdic.gov/banks); FFIEC Uniform Bank Performance Report technical guidance (estimated-tax adjustment for Subchapter S comparability); Federal Reserve Bank of Kansas City community banking bulletin (Subchapter S share of community banking organizations, September 30, 2024); NCUA 5300 Call Report delinquency schedule.
See exactly how the bank next door stacks up against your credit union in CU411. The free "You vs. the banks next door" strip on Quick Glance runs these four rules for you, and the "Include banks" toggle drops local community banks right into your benchmark report. → Open CU411
Want the underlying map? Every credit-union-to-bank pairing we use, with its comparability flag and basis note, is published openly. → The NCUA-to-FDIC Crosswalk